Earnings Per Share (EPS) is a financial ratio investors use to evaluate a company’s profitability. It represents the portion of a company’s net earnings allocated to each outstanding share of common stock. By examining EPS, you gain valuable insights into a company’s ability to generate and distribute profits to its shareholders.
This article will cover in more detail what EPS is, how to calculate it, and how it affects stock valuation.
What is Earnings Per Share?
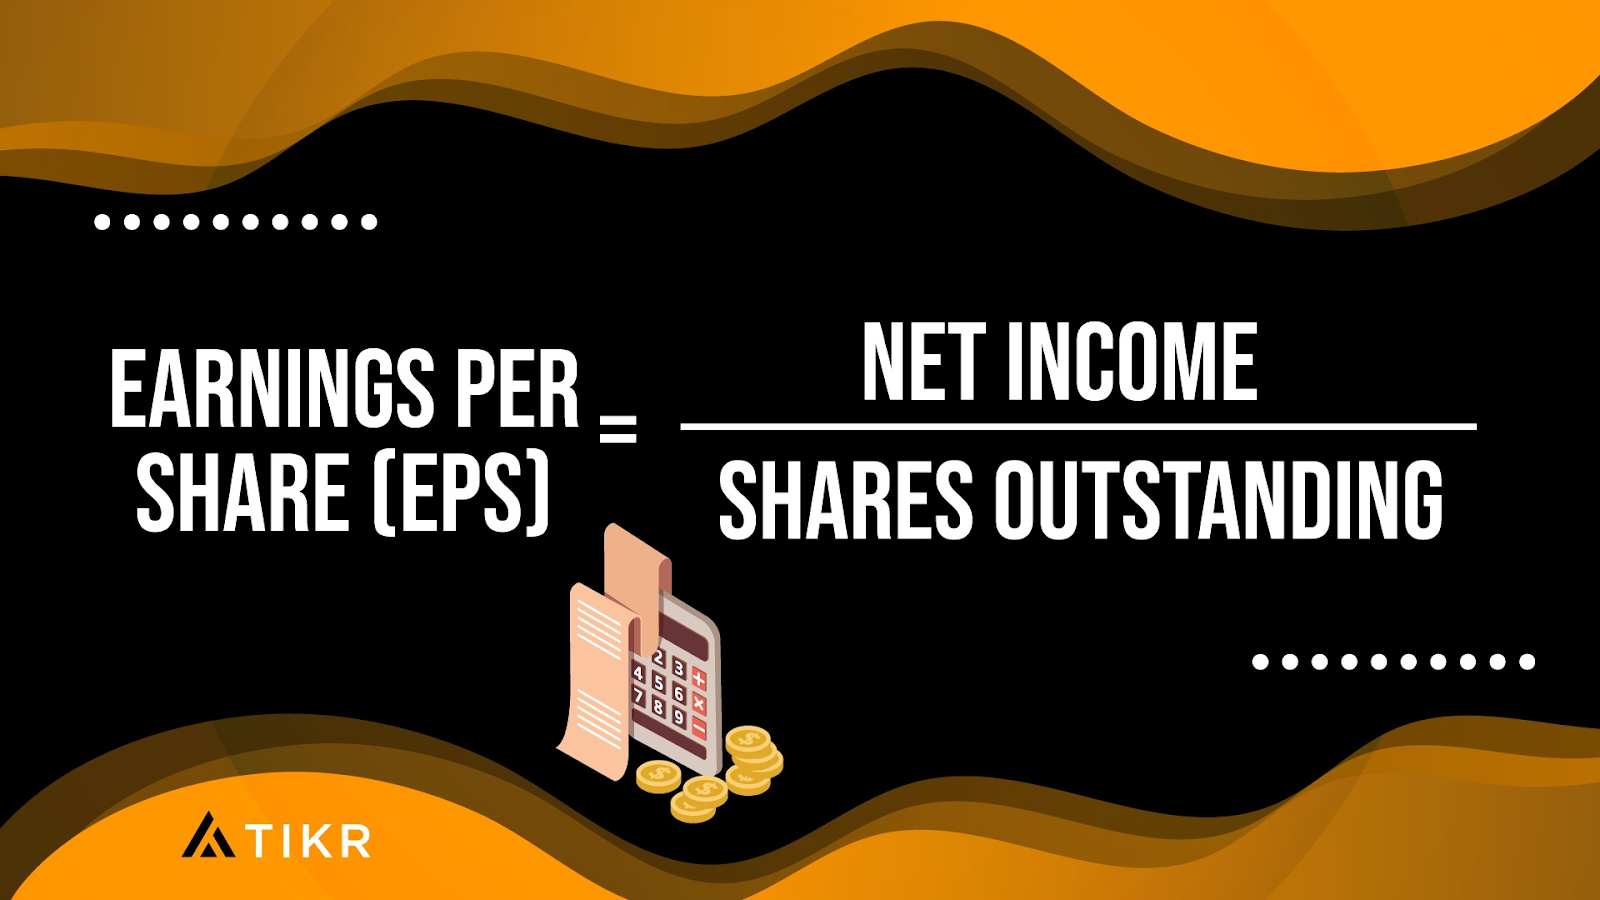
Earnings per share, or EPS, is a measure of a company’s profitability, computed by dividing net income by the total number of outstanding common shares. The resulting number shows whether a company is profitable or not.
The higher the EPS, the more profitable a company is on a per-share basis. A higher EPS generally indicates that a company is generating more earnings for each outstanding share of its common stock.
Types of EPS
There are three common types of earnings per share:
Trailing EPS
Also known as TTM EPS (Trailing Twelve Months EPS), trailing EPS reflects a company’s earnings per share over the most recent twelve-month period. It provides a historical view of the company’s profitability and financial performance over the past year.
Trailing EPS considers the company’s cumulative net earnings for the four most recent quarters. This metric is useful for assessing a company’s recent track record and evaluating its historical earnings trend.
Since trailing EPS provides historical data, most investors will also look at forward EPS.
Forward EPS
The forward EPS represents Wall Street analysts’ consensus estimates of a company’s future earnings per share for a specified period. This could be the next quarter, fiscal year, or multiple years ahead. The most commonly used period is Next Twelve Months (NTM) EPS, which is the summation of the next four quarters of forecasted EPS.
Forward EPS is based on forecasts and expectations about the company’s future financial performance. Investors and analysts often use it to make projections about a company’s potential growth and estimate its valuation.
Basic EPS vs. Diluted EPS
The main difference between basic EPS and diluted EPS is that the former doesn’t take into account the potential dilution of outstanding shares from convertible securities, such as stock options and convertible bonds.
Diluted EPS considers the potential dilution of outstanding shares from convertible securities. It assumes that all potential dilutive securities have been converted into common shares. Diluted EPS provides a more conservative measure of a company’s earnings per share by accounting for the maximum possible dilution.
EPS vs. Adjusted EPS
Adjusted EPS is a modified version of basic EPS that excludes certain non-recurring or unusual items from the company’s net income to provide a more accurate reflection of its ongoing operational performance. For example, Adjusted EPS may exclude one-time restructuring or legal costs.
These adjustments are typically made to eliminate items not directly related to the core business operations that would otherwise distort the true earnings picture.
Pro Tip: TIKR calculates Earnings Per Share in all forms (LTM, NTM, Adjusted, Basic, Diluted) on 100,000+ stocks globally.
How to Calculate Earnings Per Share
To calculate EPS, divide the net income (minus preferred dividends) by the average number of common outstanding shares.
Here’s the earnings per share formula:
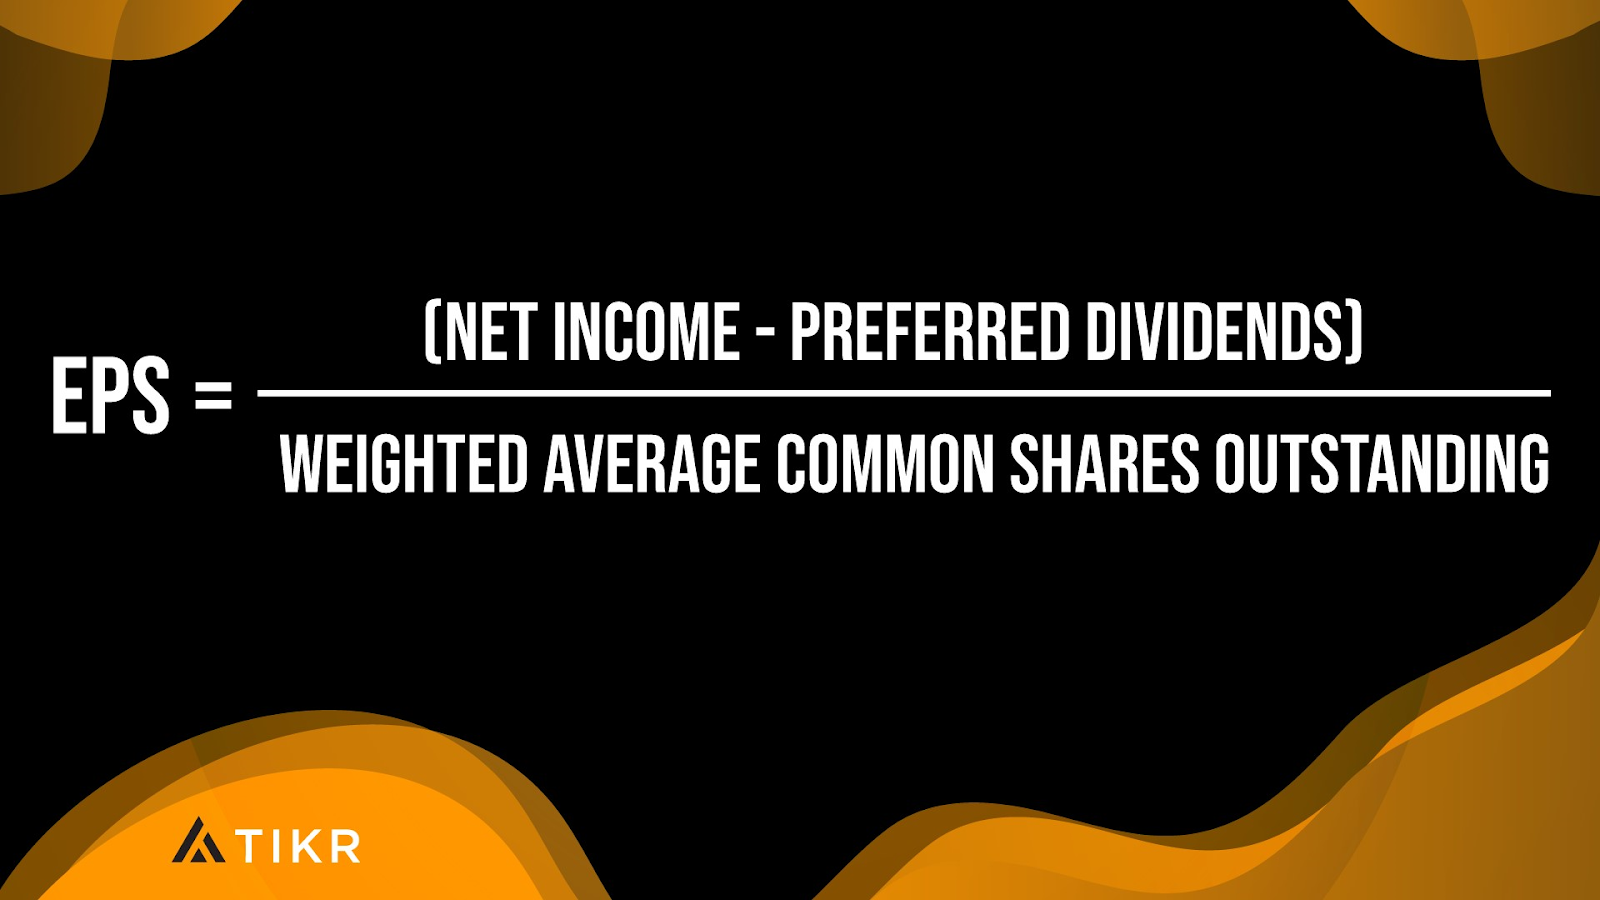
- Net Income: This is the after-tax profits a company generates over a given period.
- Preferred Dividends: Since the EPS ratio represents earnings to common shareholders, we must deduct preferred dividends issued to preferred shareholders.
- Weighted Average Common Shares Outstanding: Investors and analysts typically use the weighted average to calculate EPS because the number of common shares outstanding may change over time.
Earnings Per Share Example
Let’s go through an example of EPS calculation using Apple. For its 2022 fiscal year, the company reported a net income of $99,803,000,000 and the weighted average diluted shares outstanding were 16,325,819,000.
Apple didn’t have preferred stock outstanding, so we don’t need to subtract preferred dividends. When you divide net income by the weighted average shares outstanding, you’ll get an EPS of $6.11.
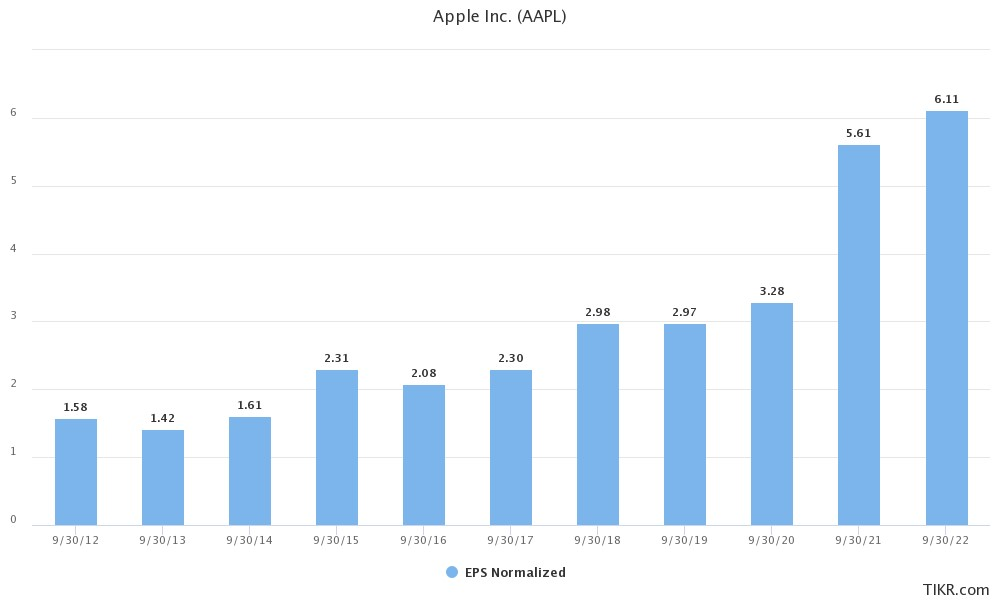
Figure 1: Apple’s Earnings Per Share over time
What Is a Good Earnings Per Share?
There’s no exact number to define a good EPS across companies. Because so many factors go into a company’s net income, EPS ratios always differ from one company to another. Also, companies can change the number of shares outstanding through stock splits or other means.
To find out if a company’s EPS is “good,” it’s a good idea to take into account its earnings per share in context. The absolute value of a company’s EPS should accelerate upward annually.
In the short-term, stock prices can be driven by whether the company’s EPS is better than was forecasted by Wall Street analysts. If companies beat the EPS estimate, this can drive the stock price higher especially in the short-term. Conversely, if companies miss analyst estimates, this can sometimes cause the stock price to decline in the short-term.
Over the long-term, the stock price of a company generally converges with the intrinsic value of the underlying business. Generally, EPS is a decent proxy for intrinsic value per share over time.
For example, AAPL’s EPS has increased meaningfully over time which has also driven its stock price higher.
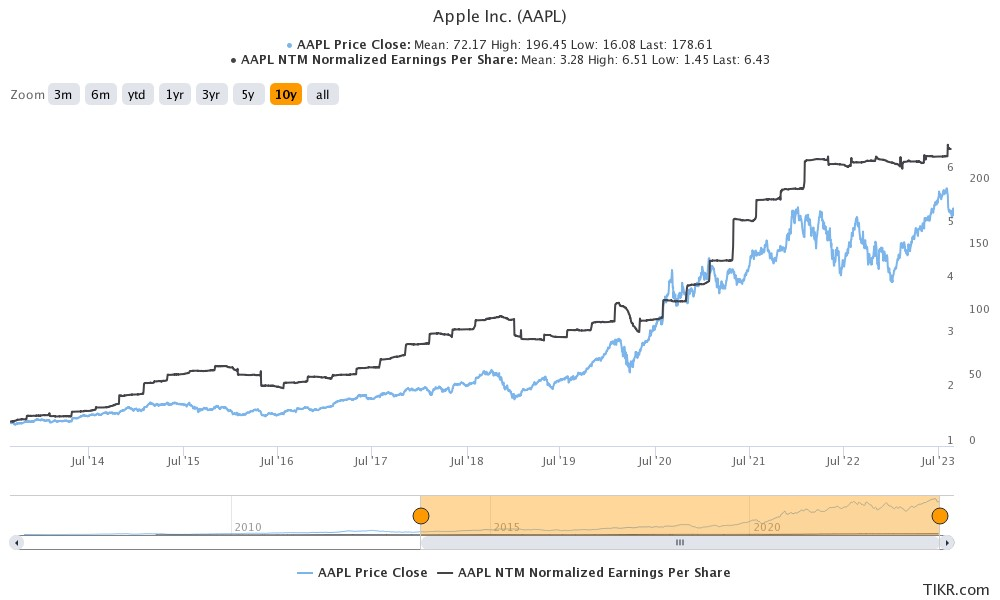
Figure 2: AAPL’s EPS and therefore stock price have increased over time
How Earnings Per Share Affects Stock Valuation
EPS is one of the many financial metrics investors use to determine whether a stock is a buy. A stock with a strong EPS growth rate is often considered a good investment, while a company with a declining EPS is generally a negative.
While EPS is a great metric for choosing stocks to buy, you shouldn’t use it solely. Using it alongside other financial ratios will give you a clear picture of a company’s profitability. One commonly used valuation metric that’s used in conjunction with EPS is the Price-to-Earnings (P/E) ratio.
Limitations of EPS
Although EPS is a great profitability measure, it’s not without drawbacks.
For one, EPS is calculated using net income which doesn’t necessarily reflect a company’s cash flow. Subtracting non-cash expenses like amortization and depreciation from net income can cause a company’s net income to differ significantly across reporting periods.
In addition, companies can game their EPS by changing their accounting policies. They can also manipulate their Adjusted EPS metrics based on what they decide is one-time or non-recurring.
The EPS ratio is most useful when used along with other financial ratios like the price-to-earnings (P/E) ratio and the return-on-equity (ROE) ratio.
Final Thoughts
EPS is an important financial metric that investors use to evaluate a company’s profitability. It represents the portion of a company’s net earnings allocated to each outstanding share of common stock. There are various EPS metrics that investors use such as Trailing EPS (LTM), Forward EPS (NTM), and Adjusted EPS.
Instead of having to manually calculate these financial metrics, TIKR.com aggregates all of this data for 100,000+ stocks globally. Get started today for free. Analyze stocks quicker with TIKR!