

Most financial tools only show a company’s revenue and earnings forecasts. These are useful, but they only tell part of the story.
Professional analysts forecast dozens of metrics to get a fuller picture of how a company is expected to perform across different areas.
These in-depth estimates give investors a deeper insight into how the business is expected to perform and greater confidence in the company’s future.
In this article, we’ll cover five of the most valuable analyst estimate metrics you can track on over 100,000 global stocks on TIKR.
Each metric highlights how analysts expect the company to perform in different areas of its business such as financial health, operational efficiency, and how it manages its capital.
You’ll get a whole new view on how you can analyze stocks with confidence, and understand how a stock is expected to perform.
In all the examples, we’ll look at Google stock and see analysts’ in-depth estimates for the company.
Let’s dive in!
What are Analyst Estimates?
Analyst estimate metrics are forward-looking forecasts created by professional equity analysts.
These estimates include forecasts for a company’s revenue and earnings per share, but they often also include forecasts for less commonly-used metrics that add depth to a company’s story.
These forecasts help shape market expectations and often influence how stocks are valued. For example, if analysts raise their free cash flow estimates, that can drive long-term investor interest even if earnings stay flat.
Platforms like TIKR make these forecasts easy to access. Instead of just seeing a business’s earnings forecast, you can track deeper trends and see where the business might be heading.
See detailed Analyst Estimates on over 100,000 global stocks on TIKR (It’s free) >>>
Analyst Estimate Metric 1: Gross Margin
Gross margin is one of the clearest indicators of a company’s pricing power.
Most stock analysis sites show a company’s net margin or operating margin forecasts, but gross marigns are particularly helpful to track because they tend to show if a company’s competitive advantages are getting stronger or weaker.
For product-based businesses like consumer brands, chipmakers, and software companies, this metric can help reveal whether the business is scaling efficiently or facing pressure from competitors and suppliers.
Analysts’ gross margin estimates for a business can help you see whether they expect the business to continue to raise prices going forward.
Gross margin is especially important to track in businesses that face input cost variability or sell through platforms with tight competition. A rising margin trend can be a sign of increased monetization strength or improving unit economics.
Find stocks analysts think will explode with TIKR’s detailed analyst estimates (It’s free) >>>
Example: Alphabet (GOOGL)
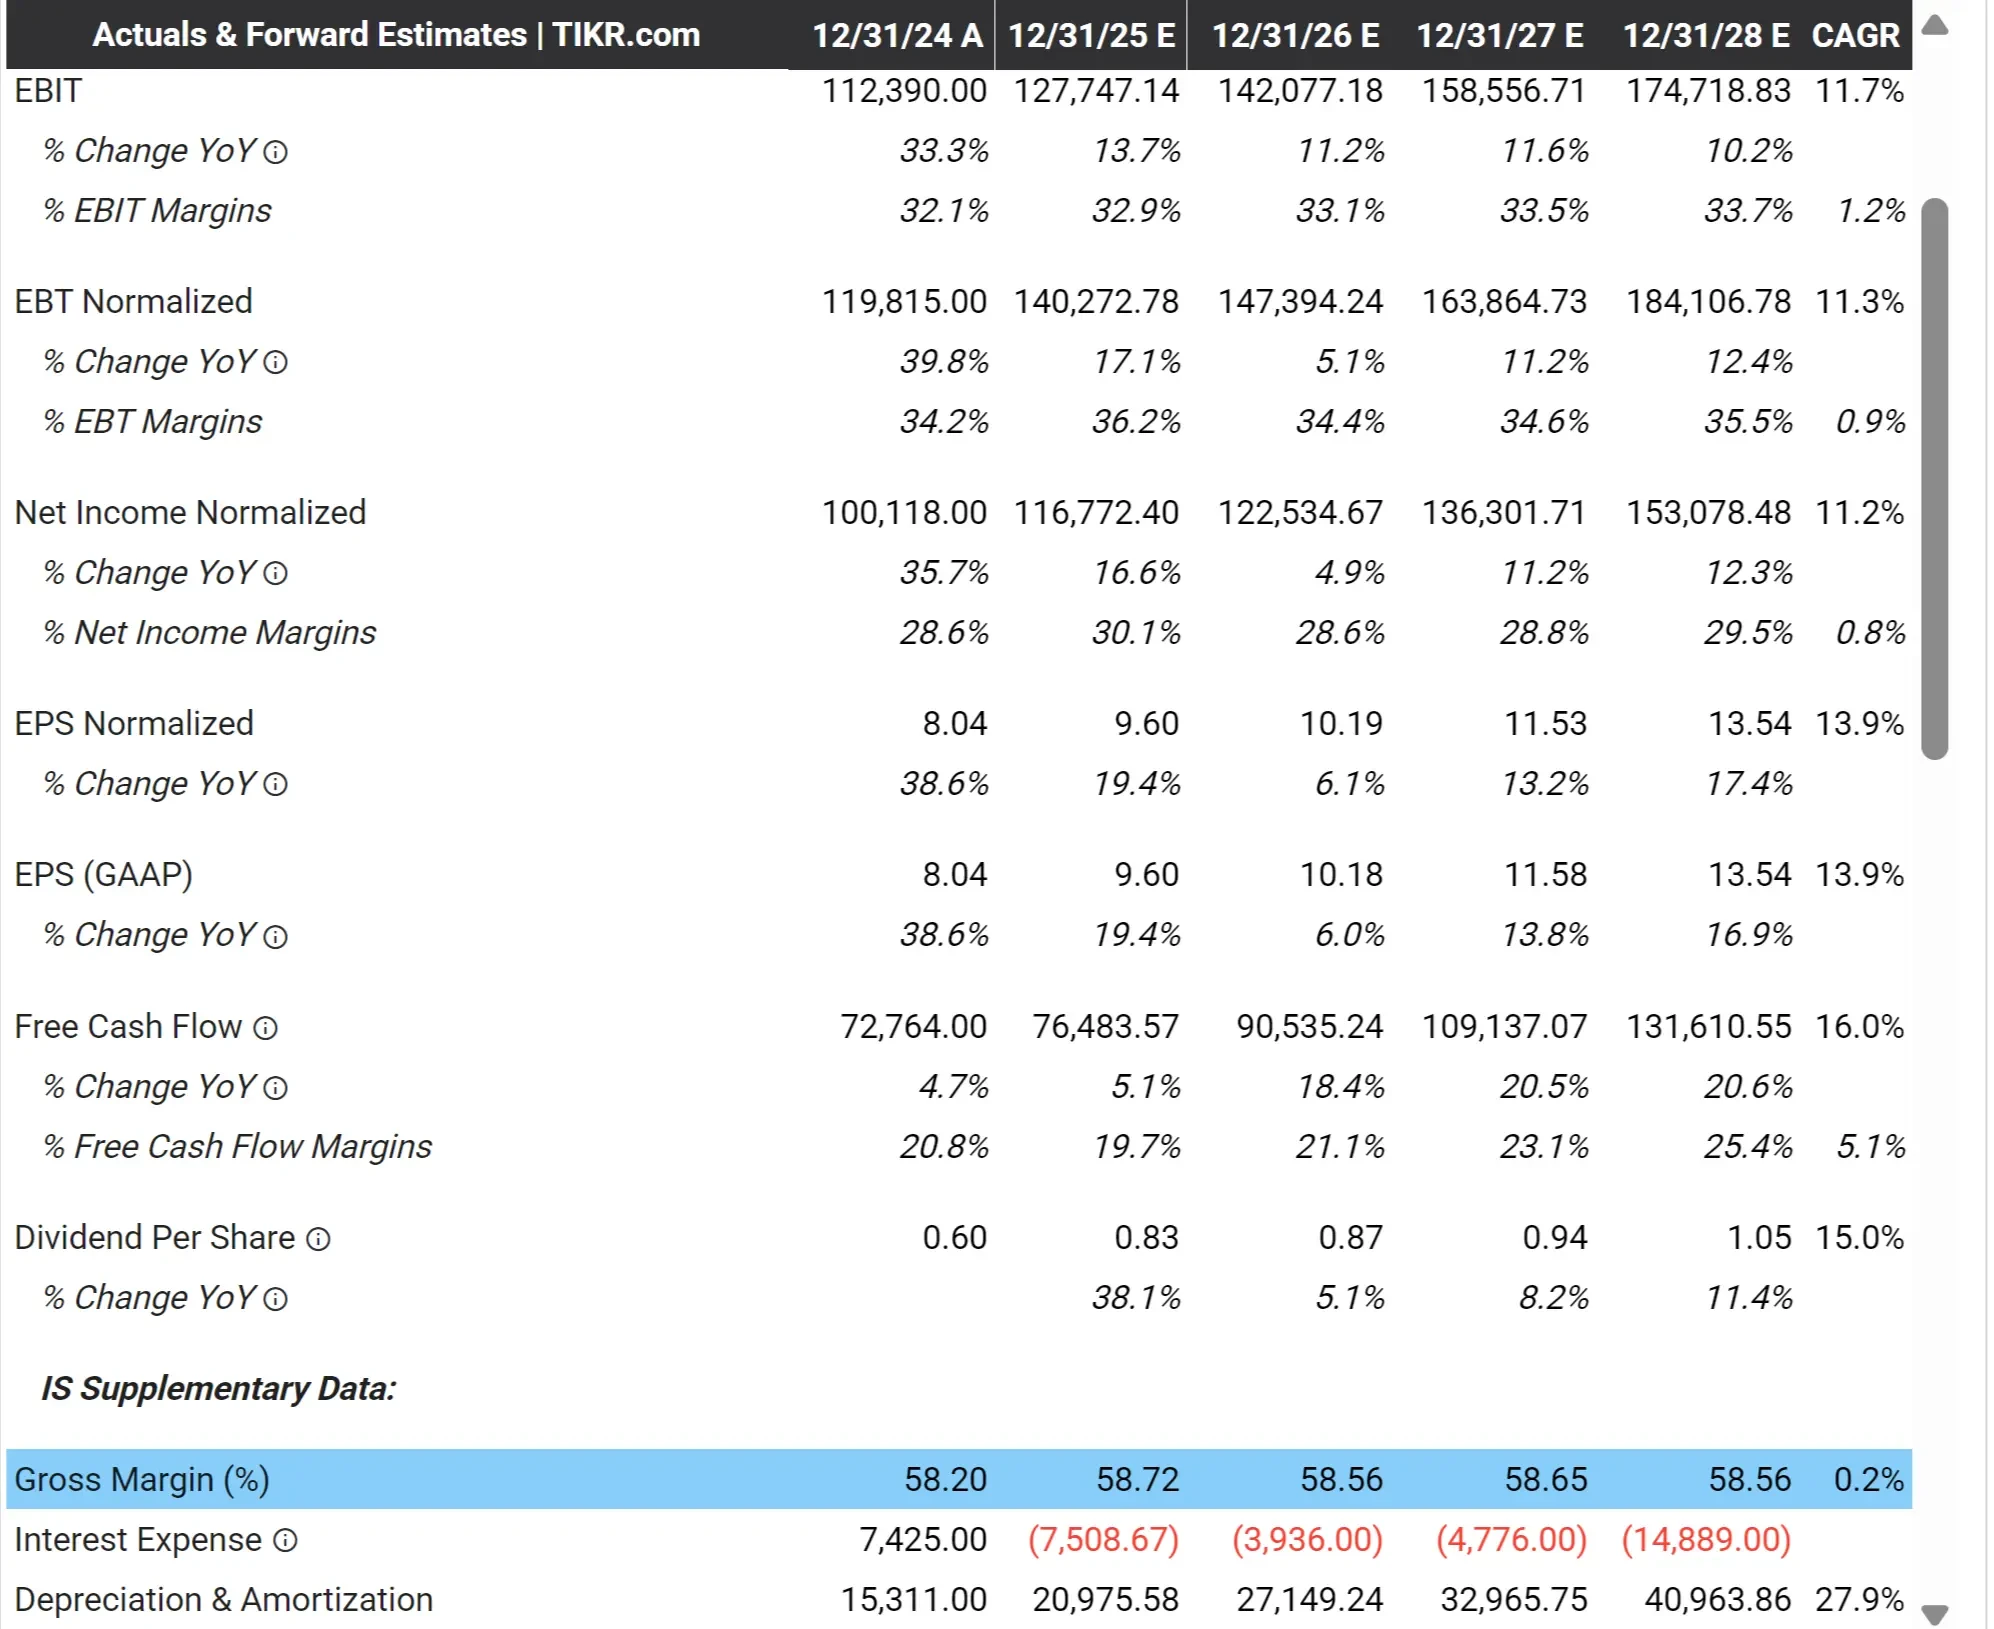
In the case of Alphabet (GOOGL), analysts estimate gross margin will stay remarkably stable over the next 3 years, hovering between 58.2% and 58.6% through 2028.
This consistency suggests analysts expect Google to maintain strong pricing power and operational control, even as costs fluctuate.
A stable or expanding gross margin can often lead to improved earnings leverage over time, especially when revenue is growing.
Analyst Estimate Metric 2: Capital Expenditures (CapEx)
Capital expenditures refers to the money a company spends to maintain or grow its physical and digital infrastructure.
For capital-intensive businesses like telecom, cloud platforms, or manufacturing, CapEx can have a major impact on free cash flow and return on invested capital.
You’ll want to check analysts’ CapEx forecasts for a company, because CapEx spending can drive long-term growth for a stock. However, increased CapEx can often hurt near-term profits since it is an expense.
CapEx forecasts are most useful in industries that rely on ongoing investment cycles to stay competitive. High CapEx is not necessarily a red flag if it leads to greater long-term efficiency or revenue growth. What matters is the relationship between CapEx and operating performance.
If margins expand or revenue accelerates following heavy investment, it can signal high returns on those projects. On the other hand, rising CapEx with no improvement in financial performance can dilute returns.
Example:
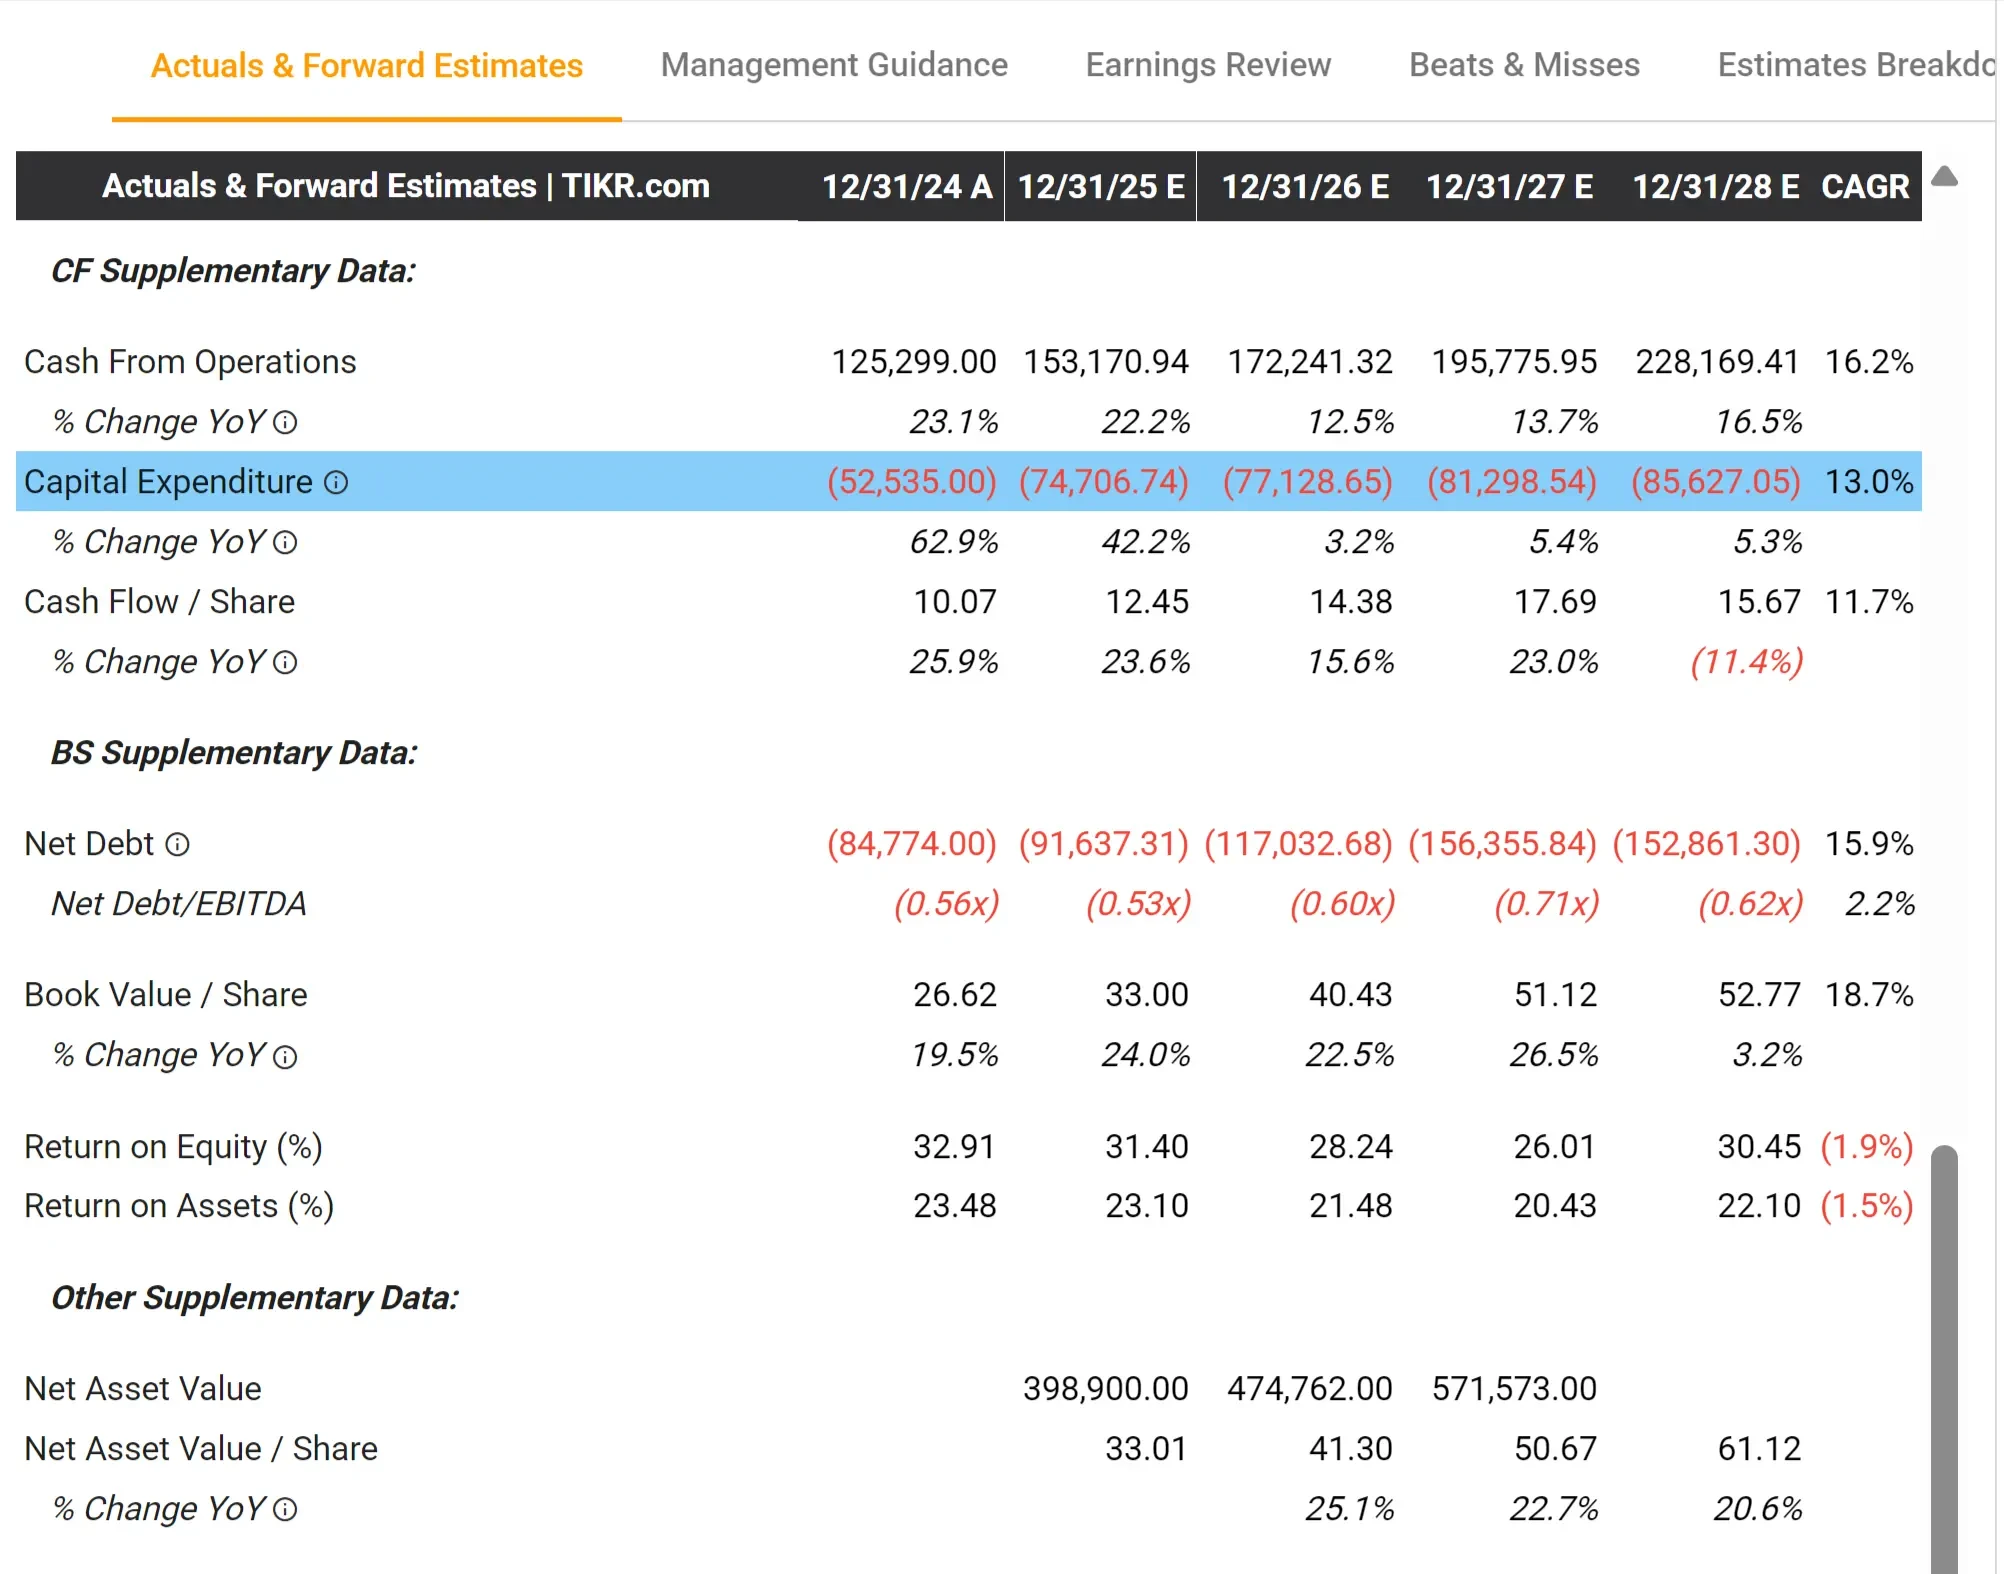
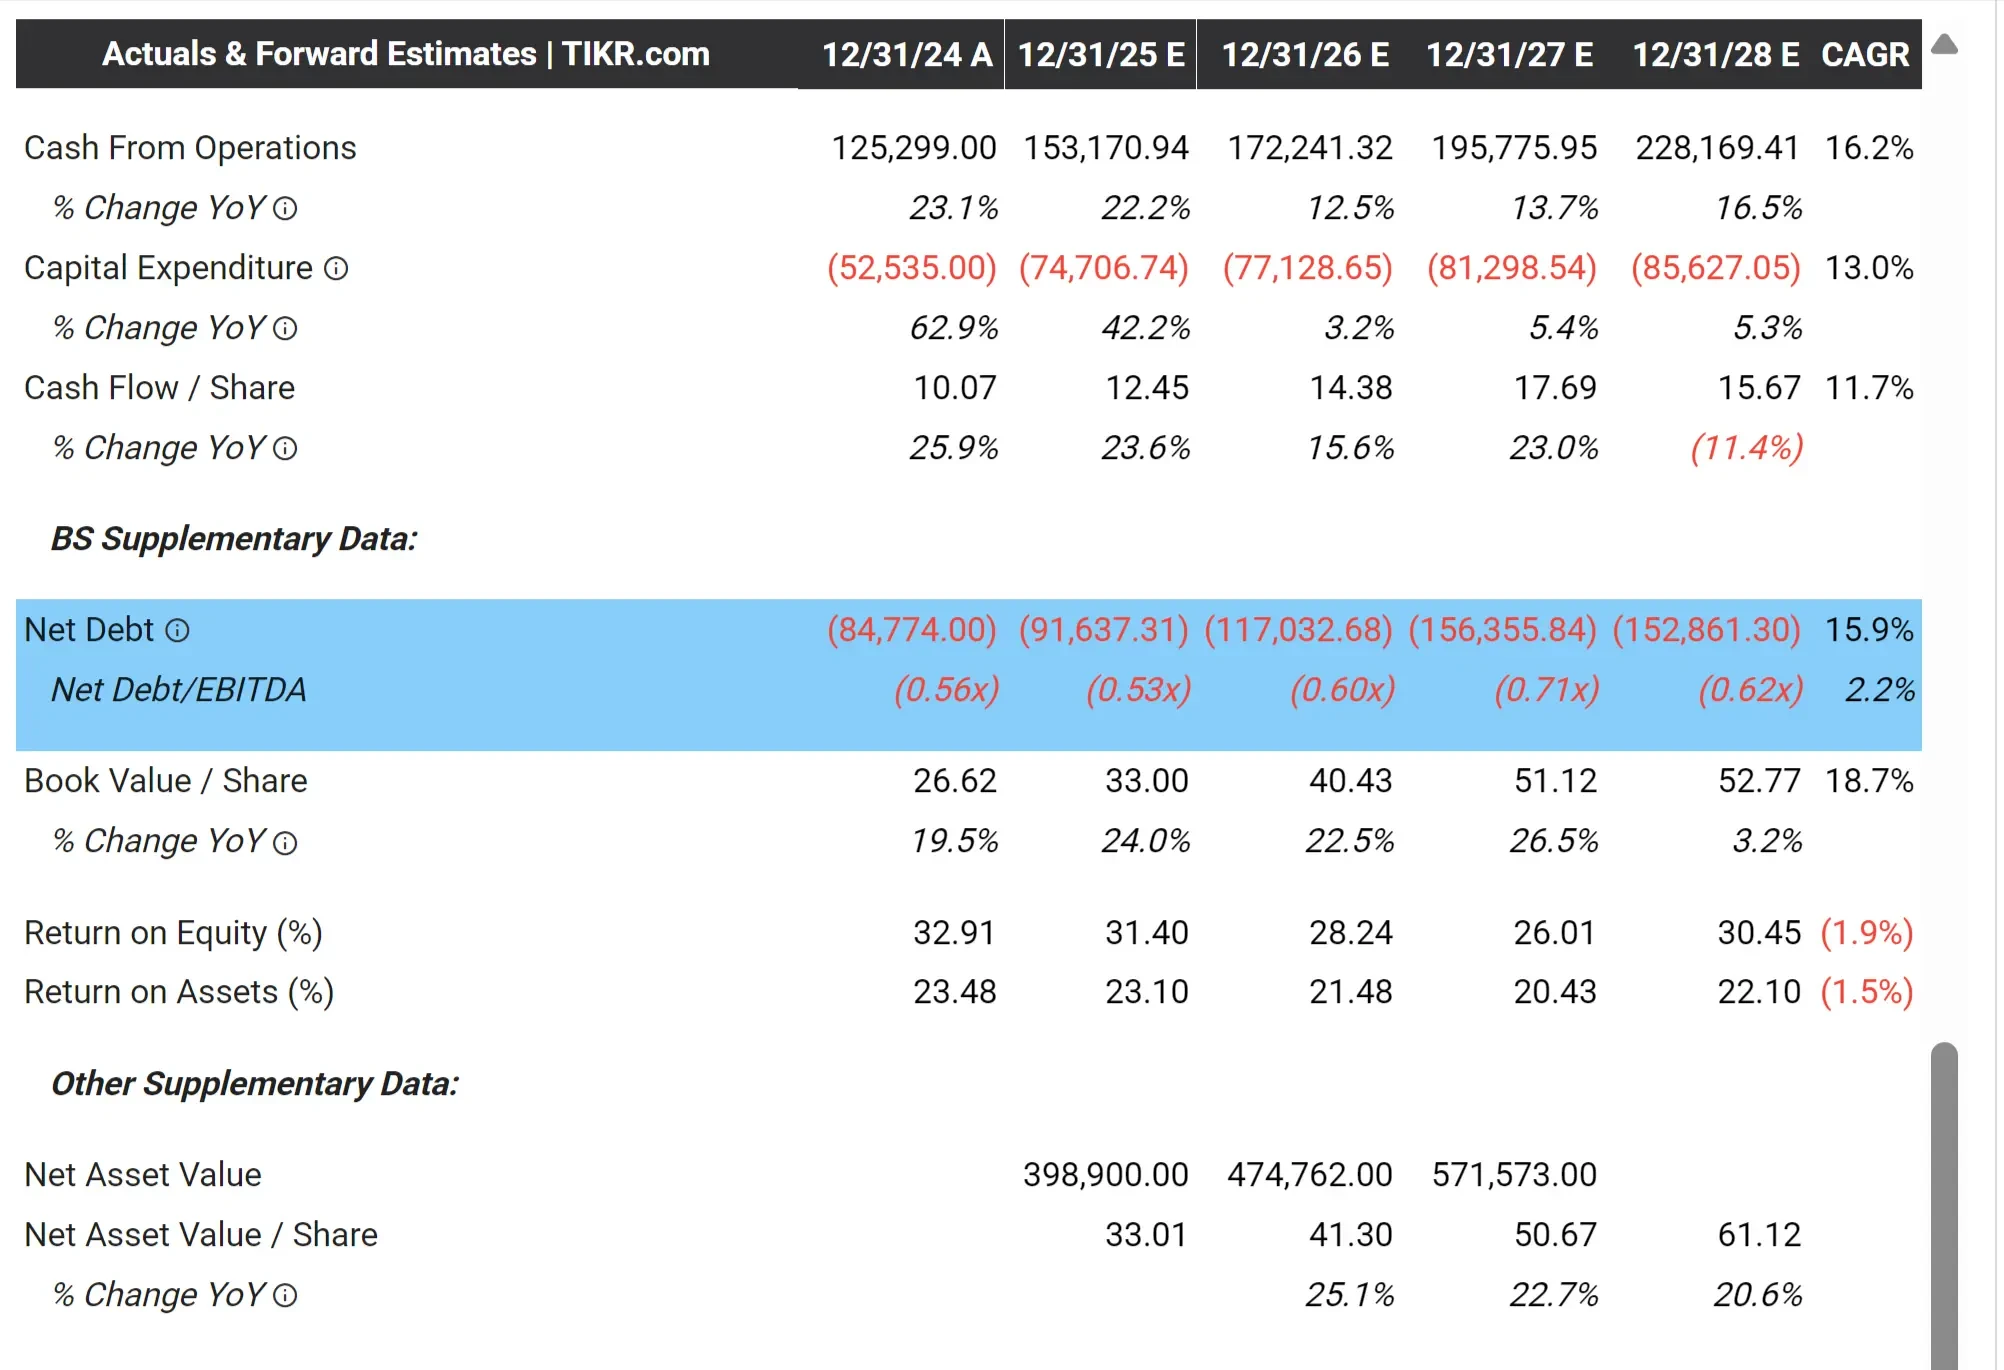
For Google, analysts are forecasting steady increases in CapEx, rising from about $52.5 billion in 2024 to over $85.6 billion by 2028.
CapEx spending is expected to grow at a compound annual growth rate of 13%. This spending is likely tied to ongoing investments in data centers, AI infrastructure, and Google Cloud expansion.
Analyst Estimate Metric 3: Return on Equity (ROE)
Return on equity measures how efficiently a company generates profit using shareholders’ equity. It is one of the clearest signals of a company’s ability to create value over time.
Return on equity is an important metric to check because if analysts forecast that a company will see higher ROE, they might expect the company to see strong margins and increasing competitive advantages going forward.
This metric is especially important for mature companies that are no longer growing revenue at very high rates. High ROE can support long-term compounding, even in lower-growth environments.
It is also a sign that management is allocating capital efficiently, which is key for businesses that generate large amounts of free cash flow like Google.

Example:
Analyst estimates Google will see returns on equity ranging from 32.9% in 2024 to a projected 30.5% in 2028. While ROE is expected to decrease in 2025, 2026, and 2027, Google’s ROE remains well above average for large-cap companies.
An ROE above 20 percent is generally considered strong, so Google’s consistently high ROE suggests the company is able to reinvest earnings effectively and maintain solid profitability even as it scales.
Analyze stocks quicker with TIKR >>>
Analyst Estimate Metric 4: Net Debt/EBITDA
The net debt to EBITDA ratio measures a company’s financial leverage by comparing its debt load to its operating earnings. A lower ratio suggests a stronger balance sheet and greater flexibility to handle economic uncertainty or fund future growth.
It’s important to see analysts’ estimates for Net Debt/EBITDA and other debt-related forecasts especially for companies that are deleveraging or are in the midst of a turnaround. If estimates show leverage improving, it can validate that the company’s recovery efforts are working.
Net Debt/EBITDA forecasts are especially useful in industries where companies take on significant debt to grow, such as telecom, utilities, or industrials. In those cases, a rising ratio can flag risk, while a declining ratio signals improving financial health.
Example:
In Google’s case, the net debt figure is negative throughout the forecast period, meaning the company has a negative net debt because the company holds more cash than debt. Analysts estimate net debt will stay below zero through 2028, and the net debt to EBITDA ratio remains deeply negative across all years. In 2024, the ratio is estimated at -0.56x and stays below -0.7x for most of the forecast horizon.
See what the world’s best investors are buying with TIKR (It’s free) >>>
Analyst Estimate Metric 5: Free Cash Flow
Free cash flow (FCF) measures the cash a company generates after accounting for capital expenditures. It represents the money left over to pay down debt, return capital to shareholders, or reinvest in growth.
Analysts often prefer to follow a company’s FCF over net income because it reflects the company’s actual financial flexibility.
Seeing a company’s free cash flow forecast is especially important for companies that have just turned profitable, and are looking to generate a cash profit.
Example:
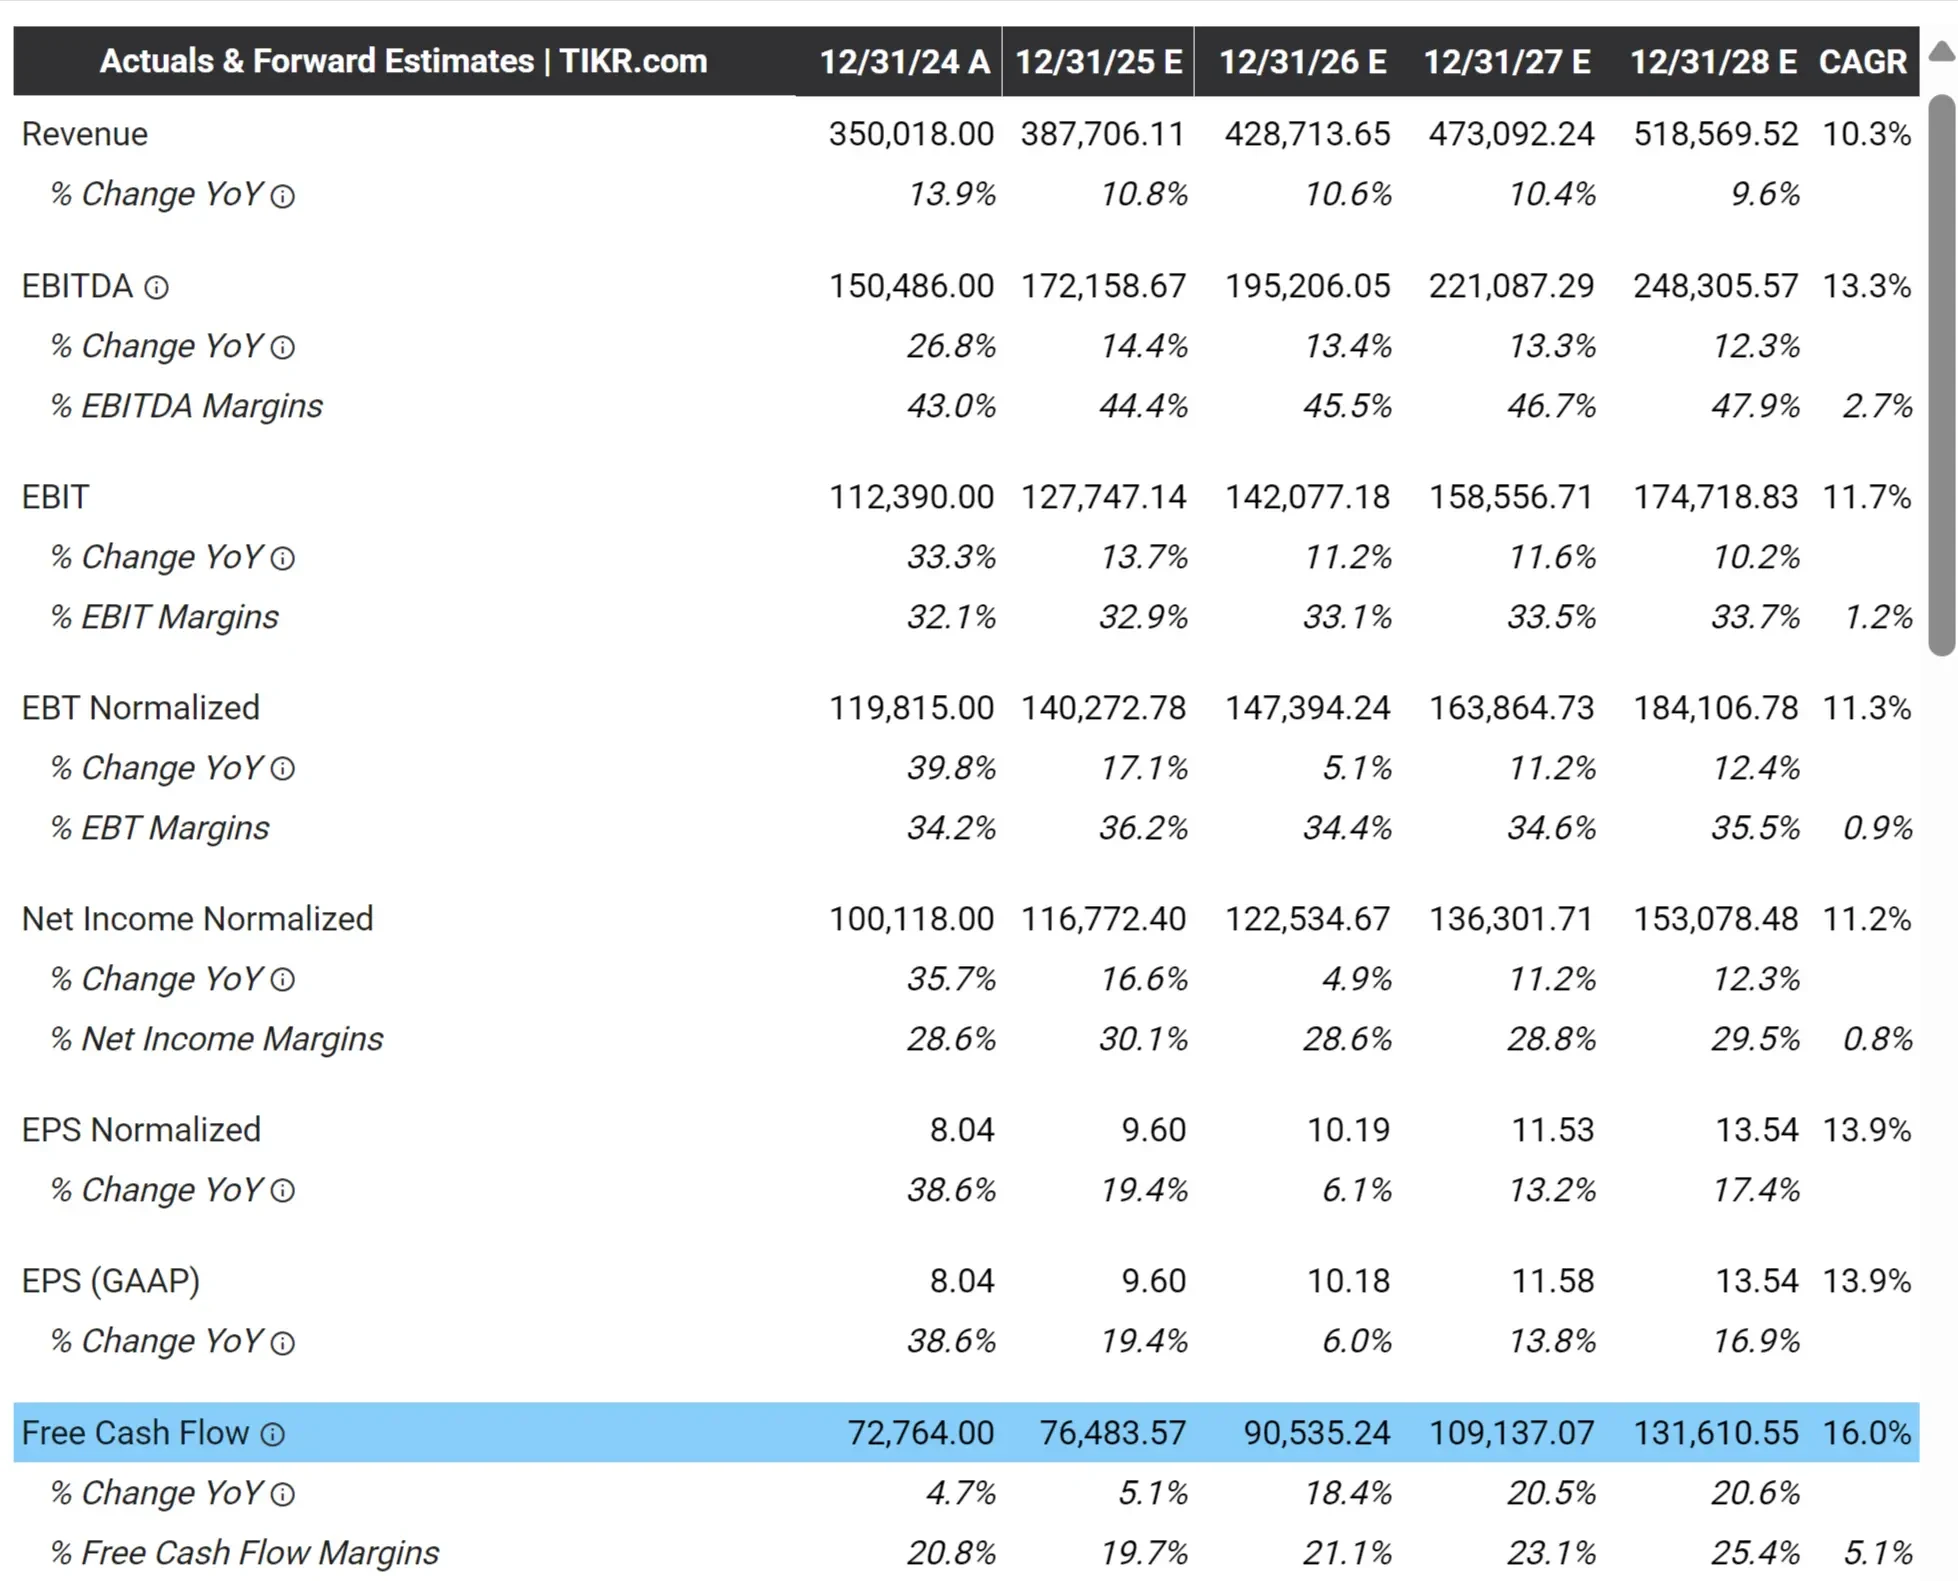
For Google, analyst estimates show free cash flow is expected to grow significantly over the next 3 years. It is expected to rise from about $72.8 billion in 2024 to over $131.6 billion in 2028.
That equates to a compound annual growth rate of 16%, which is faster than the company’s projected revenue growth. Analysts also forecast FCF margins improving from 20.8% to 25.4%, suggesting Google is becoming more efficient at converting revenue into cash.
In Google’s case, it suggests that as the business grows, more of each dollar in sales is turning into usable capital. That supports long-term shareholder returns through buybacks, dividends, and reinvestment in high-return initiatives like AI or cloud infrastructure.
Access Full Analyst Estimates on TIKR
TIKR gives you access to detailed analyst forecasts for practically any financial metrics, you can think of, including gross margins, free cash flow, capital expenditures, return on equity, debt ratios, and more. Everything’s broken out by year and updated in real time as estimates change.
Having this level of visibility helps you understand how professional analysts expect the business to evolve and can give you more confidence in a business’s future.
You can see if expectations are going up or down, and make smarter investing decisions using the same forecasts that professionals use.
See detailed Analyst Estimates on over 100,000 global stocks on TIKR (It’s free) >>>
FAQ Section:
What kinds of analyst estimates are most useful beyond revenue and earnings?
Some of the most useful analyst forecasts include free cash flow, gross margin, return on equity, capital expenditures, and debt-to-EBITDA ratios. These metrics help investors evaluate how efficiently a company operates, how it invests, and how much financial flexibility it has. They provide a more complete view of a company’s future performance than earnings alone.
Why are analyst estimates important for investors?
These estimates shape market expectations and often influence stock prices. They provide insight into a company’s financial strength, efficiency, and capital use. By tracking these forecasts, investors can better anticipate changes in a company’s outlook and valuation.
Where can I find analyst estimate data?
Platforms like TIKR provide access to detailed analyst estimates across a wide range of financial metrics. You can also find some of this information in earnings reports, investor presentations, or through financial data providers like Bloomberg and FactSet.
How often are analyst estimates updated?
Analyst estimates are typically updated throughout the quarter, especially after earnings releases, management guidance, or major news. TIKR updates these estimates in real time as new reports are filed, so investors can see the most current expectations.
Do all companies have analyst forecasts?
Not always. Larger, well-covered companies tend to have more detailed analyst estimates across many metrics. Smaller or less-followed companies may only have revenue and earnings projections. The more analysts cover a stock, the more complete the forecast data will usually be.
TIKR Takeaway:
It’s important for investors to understand the full range of a company’s analyst forecasts. Estimates for a company’s revenue and earnings are helpful, but so are estimates for metrics like free cash flow, CapEx, return on equity, debt levels, and profit margins. These metrics offer a deeper view of a company’s financial health and future performance.
By tracking these trends over time, you can build more confidence in your investment decisions and stay aligned with how professional analysts view the business.
The TIKR Terminal offers in-depth analyst estimates on over 100,000 global stocks, so if you’re looking to find the best stocks to buy for your portfolio, you’ll want to use TIKR!
TIKR offers institutional-quality research for investors who think of buying stocks as buying a piece of a business.
Looking for New Opportunities?
- See what stocks billionaire investors are buying so you can follow the smart money.
- Analyze stocks in as little as 5 minutes with TIKR’s all-in-one, easy-to-use platform.
- The more rocks you overturn… the more opportunities you’ll uncover. Search 100K+ global stocks, global top investor holdings, and more with TIKR.
Disclaimer:
Please note that the articles on TIKR are not intended to serve as investment or financial advice from TIKR or our content team, nor are they recommendations to buy or sell any stocks. We create our content based on TIKR Terminal’s investment data and analysts’ estimates. We aim to provide informative and engaging analysis to help empower individuals to make their own investment decisions. Neither TIKR nor our authors hold any positions in the stocks mentioned in this article. Thank you for reading, and happy investing!