


Key Stats for Netflix Stock
- Current Price: $87.68
- Target Price (Mid): ~$179
- Street Target: ~$115
- Potential Total Return: ~104%
- Annualized IRR: ~17% / year
- Earnings Reaction: -9.72% (4/16/26)
- Max Drawdown: -43.35% (2/12/26)
Now Live: Discover how much upside your favorite stocks could have using TIKR’s new Valuation Model (It’s free) >>>
What Happened?
Netflix, Inc. (NFLX) is sitting 35% below its 52-week high, and the market’s explanation for why is only half the story.
The stock closed at $87.68 on May 26, down from a 52-week high of $134.12 and not far above its 52-week low of $75.01. The bear case has been well-rehearsed since the 9.72% post-earnings drop on April 16: Q2 guidance missed analyst expectations, Reed Hastings is stepping down from the board in June, and engagement growth has slowed to roughly 2% year-over-year. Some analysts, including Pivotal Research’s Jeffrey Wlodarczak, have argued that short-form competition from TikTok and YouTube is applying the same pressure to streaming that streaming once applied to traditional TV.
That risk is real. It is also largely reflected in the stock price already. What is not reflected is what Netflix disclosed at its May 13 Upfront presentation: an ad-supported tier that has grown from 70 million monthly active viewers in 2024, to 94 million in 2025, to more than 250 million today.
Why the Selloff Happened
The post-earnings reaction on April 17 was rational. Netflix guided Q2 2026 revenue to $12.5 billion, below the $12.6 billion consensus, and Q2 EPS to $0.78 against an $0.84 expectation. On the same call came the announcement that co-founder Reed Hastings would not stand for re-election at the June shareholder meeting. Two negatives in one session sent the stock down 9.72%.
But the actual Q1 results were strong. Revenue grew 16.2% year-over-year to $12.25 billion, beating estimates. Operating income rose 18.2% to $3.96 billion, with operating margin expanding to 32.3%. Q1 free cash flow came in at $5.09 billion, and management raised full-year 2026 FCF guidance to $12.5 billion as a result of the $2.8 billion Warner Bros. termination fee. Net debt to EBITDA sits at just 0.30x per TIKR data.
The Q2 guidance softness also reflects a timing dynamic CFO Spence Neumann flagged on the call: Q2 will carry “the highest year-over-year content amortization growth rate” of all of 2026, before decelerating to mid-to-high single-digit growth in the back half. The cost pressure is front-loaded.

See historical and forward estimates for Netflix stock (It’s free!) >>>
The Ad Business That The Market Is Underpricing
The most important number from the past month is 250 million.
That is Netflix’s ad-supported tier’s monthly active viewer count as of the May 13 Upfront, up from 94 million just a year ago. More than 80% of those viewers watch weekly. More than 60% of new sign-ups in ad-tier markets now choose the ad-supported plan, per Netflix’s Q1 shareholder letter.
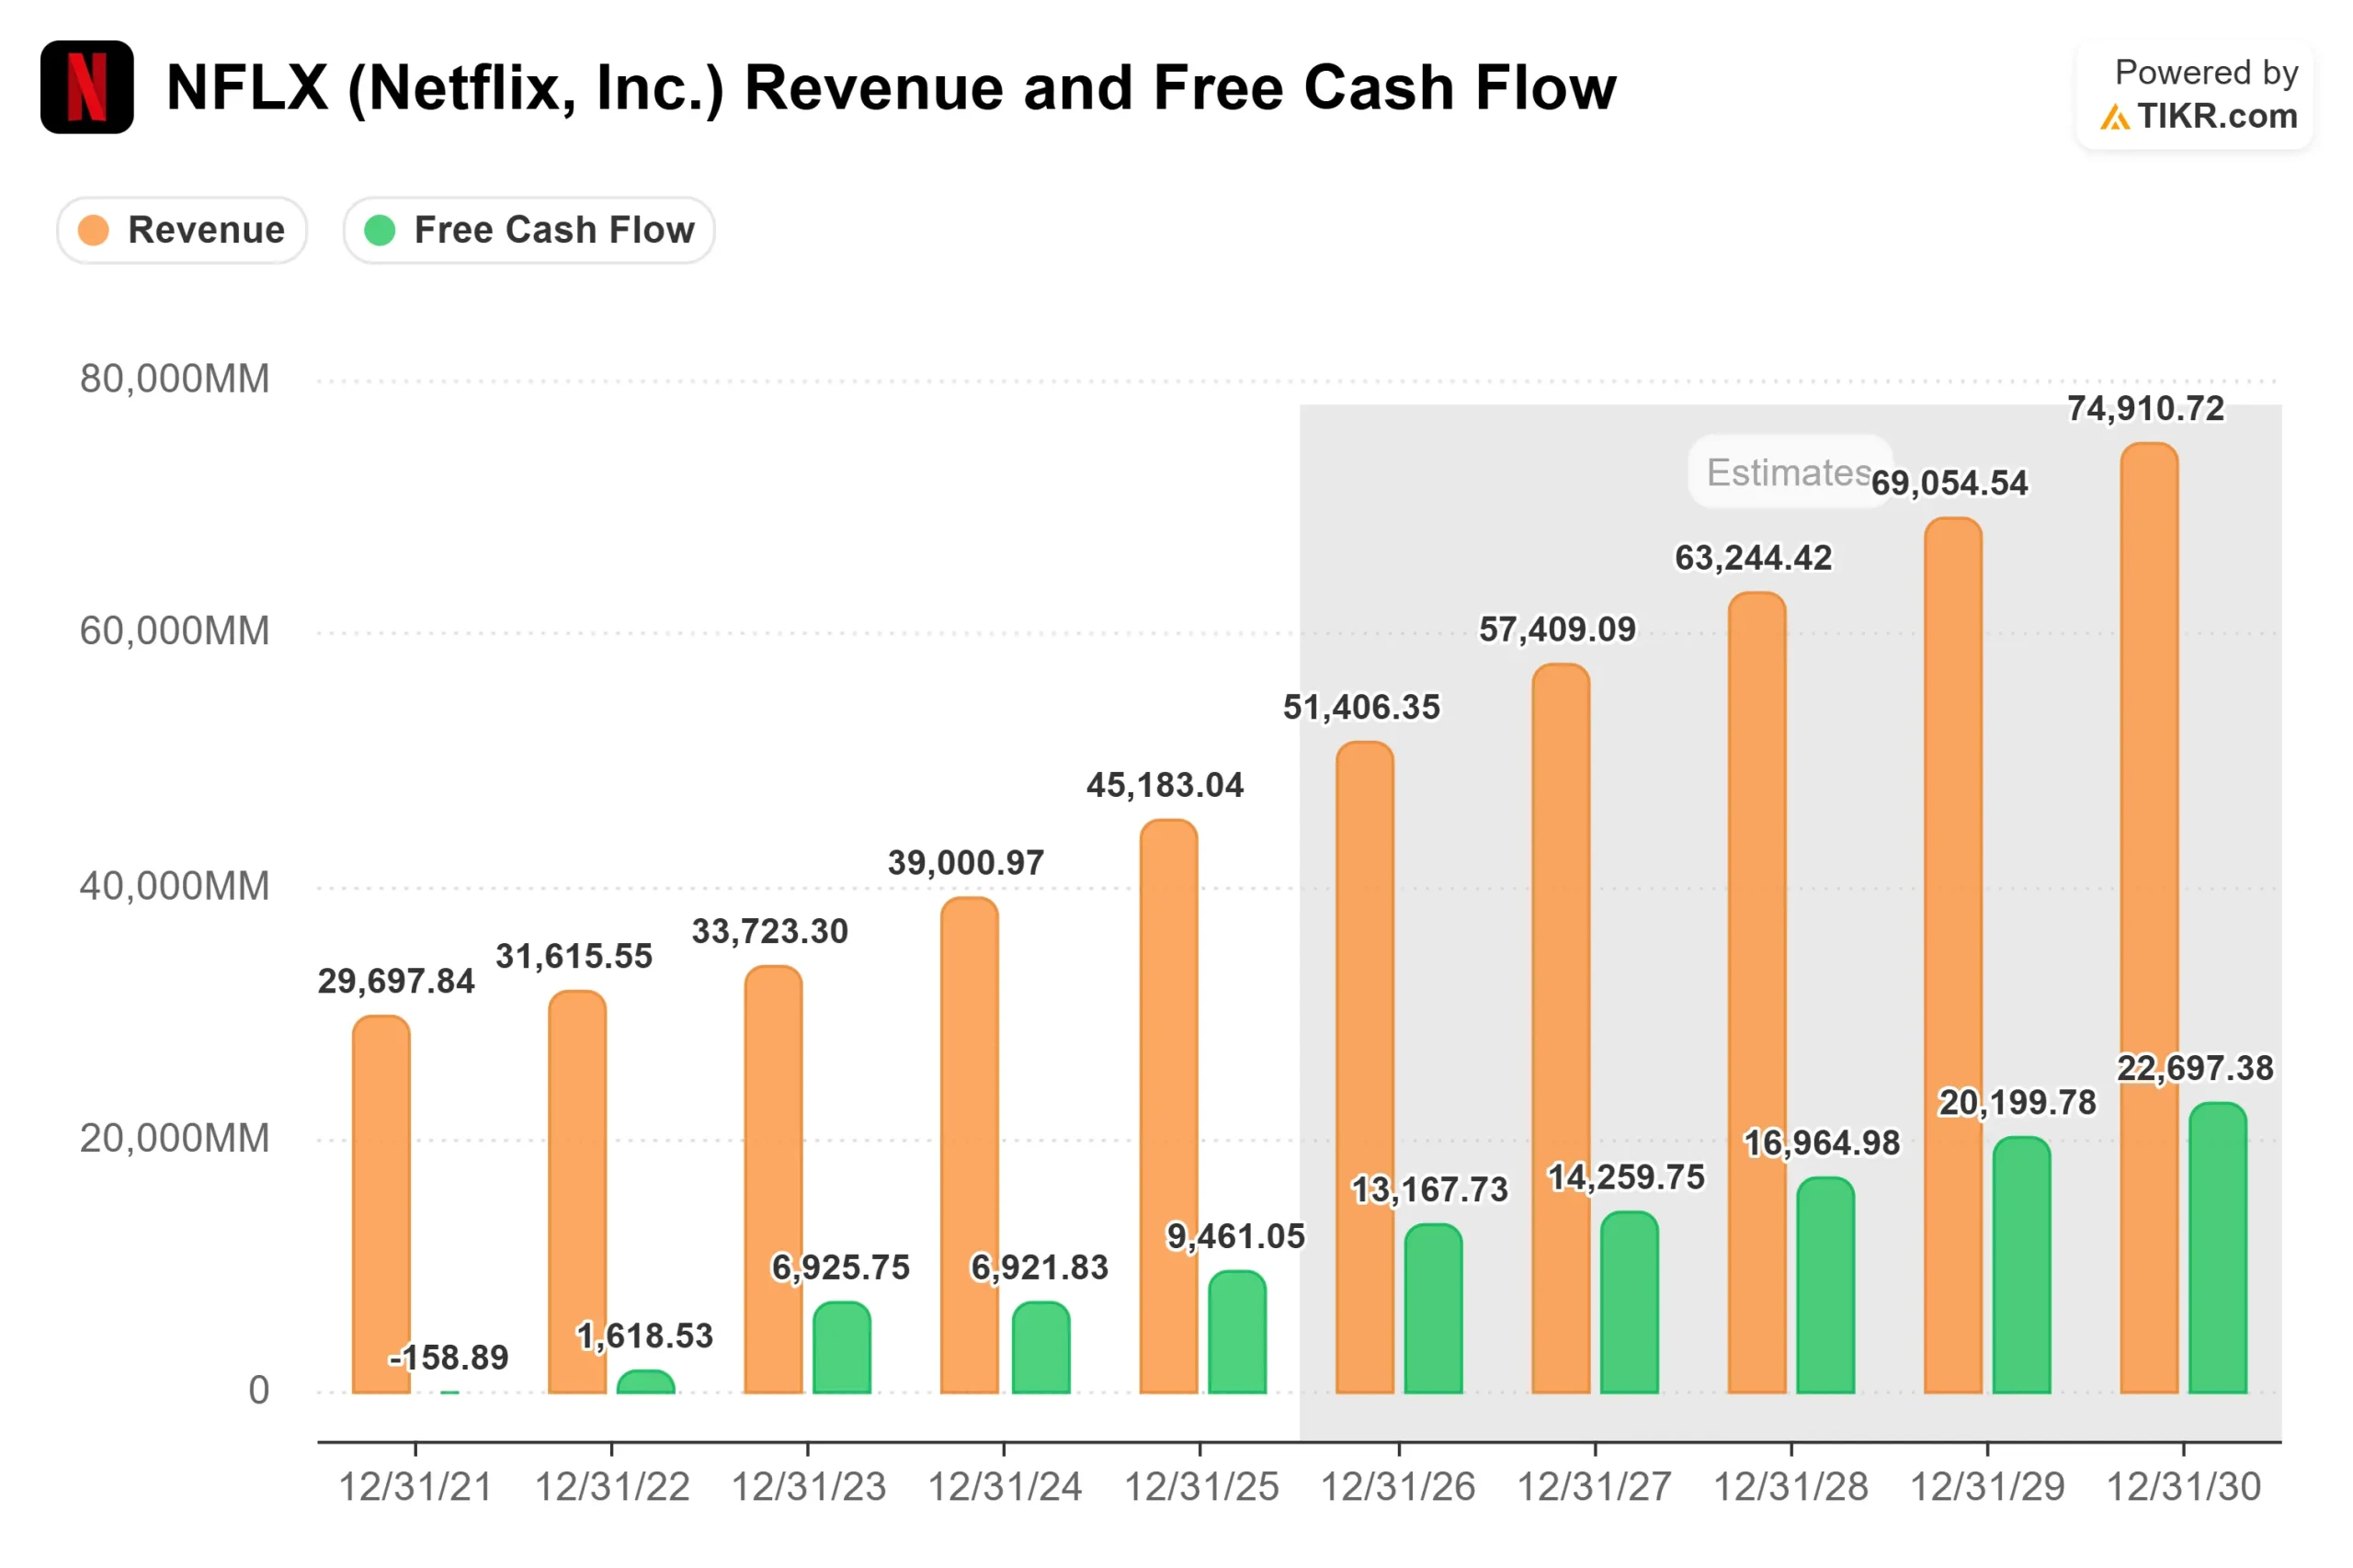
Co-CEO Greg Peters described the mechanics on the earnings call: programmatic advertising (automated ad buying) is “on its way to becoming more than 50% of our nonlive ads business,” and the advertiser base grew over 70% year-over-year in 2025 to more than 4,000 brands. Netflix’s full-year 2026 ad revenue target is around $3 billion, double the $1.5 billion generated in 2025. Netflix has also outlined an internal goal of $9 billion in annual ad revenue by 2030, a figure Goldman Sachs independently projects at approximately $9.5 billion on the same timeline.
Starting in 2027, Netflix will expand its ad-supported tier to 15 new countries, including the Philippines, Indonesia, Colombia, Sweden, and Switzerland. That adds an addressable market at the exact moment the existing 12-market business is approaching scale.
Ad revenue carries higher incremental profit margins than subscription revenue alone. As it grows from roughly 3% of total revenue today toward something materially larger, it changes the margin trajectory for the whole business in ways that current consensus estimates do not yet capture.
Why the Engagement Bear Case Is Incomplete
Netflix’s view hours grew roughly 2% year-over-year in Q1 2026, consistent with the second half of 2025. That number, taken alone, is not exciting. But Greg Peters explained on the call why Netflix has moved away from raw view hours as its primary internal signal.
Netflix’s internal member quality metric, which incorporates retention depth and engagement signals, hit an all-time high in Q1 2026, the second consecutive record after Q4 2025. Churn improved year-over-year in every region. If engagement were genuinely eroding, churn would be rising. The data shows the opposite.
What is changing is the composition of engagement, not its level. Ted Sarandos noted on the call that the World Baseball Classic drove 31.4 million viewers in Japan, making it the most-watched program in Netflix Japan’s history. It also drove the platform’s largest single sign-up day ever in that market, and Japan led global member growth for the quarter. Podcasting is opening daytime and mobile engagement windows that did not previously exist for Netflix. Gaming is showing early retention benefits. None of these registers cleanly in a view-hours metric, which is exactly why Netflix built a different one.
What Wall Street Thinks
Per TIKR data as of May 26, 2026, analyst sentiment stands at 29 Buys, 8 Outperforms, 13 Holds, 1 Underperform, and 1 Sell across 44 estimates, with a mean Street target of around $115. B of A Securities reiterated its Buy with a $125 target on May 18. JPMorgan’s Doug Anmuth carries an Overweight and $120 target, upgraded in March when Netflix walked away from the Warner Bros. deal. BMO’s Brian Pitz holds an Outperform at $135, citing engagement quality and improving ad fill rates. Pivotal’s Wlodarczak is the clearest bear at Hold and $96, arguing growth is increasingly driven by price increases rather than subscriber additions.
On valuation multiples, NFLX trades at 20.80x NTM EV/EBITDA per TIKR. Disney (DIS) trades at 9.05x and Spotify (SPOT) at 27.33x on the same basis. Netflix’s premium over Disney reflects a structurally superior margin and free cash flow profile. Its near-parity with Spotify is notable: Spotify generates far less free cash flow and is earlier in its advertising business. At 20.80x, Netflix’s multiple is pricing in a business in managed decline, not one with a $9 billion ad revenue target and accelerating programmatic scale.
See how Netflix performs against its peers in TIKR (It’s free!) >>>
TIKR Advanced Model Analysis
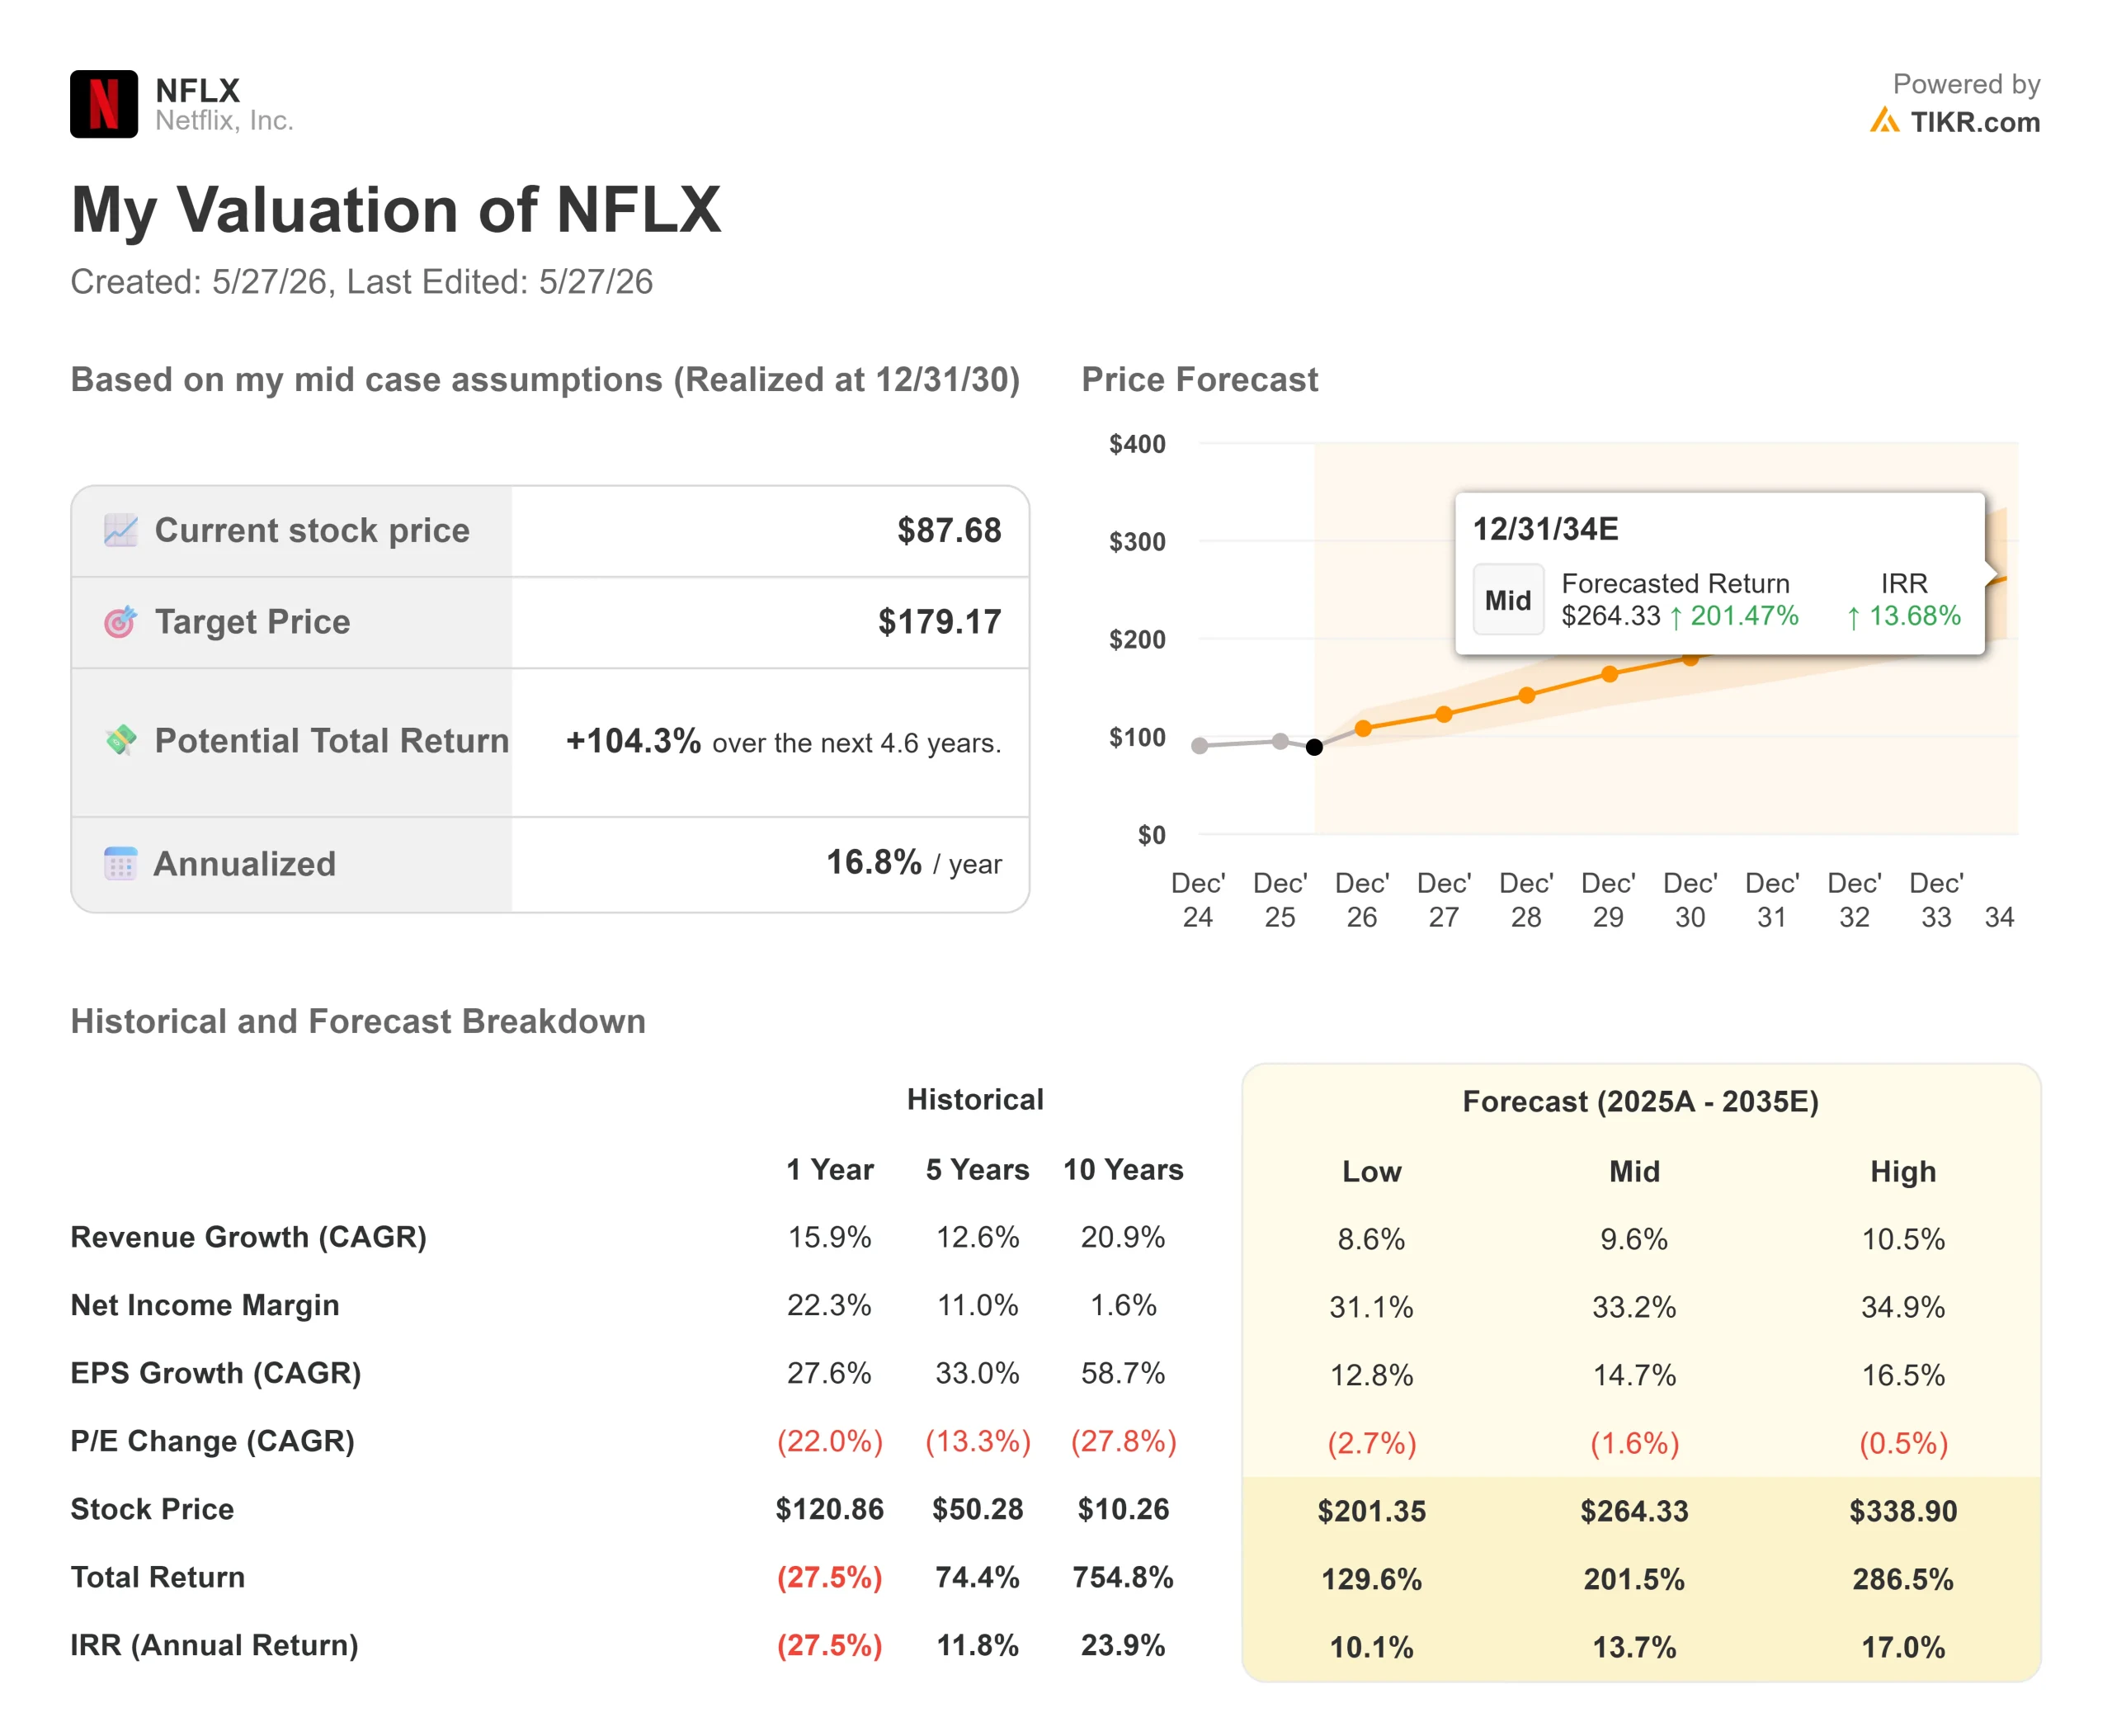
- Current Price: $87.68
- Target Price (Mid): ~$179
- Potential Total Return: ~104%
- Annualized IRR: ~17% / year
See analysts’ growth forecasts and price targets for Netflix stock (It’s free!) >>>
The TIKR mid-case uses a revenue CAGR of around 10% and net income margins expanding toward around 33%. Two things drive the revenue line: ad-tier monetization scaling across the existing member base, and geographic expansion of advertising into 15 new markets starting in 2027. The margin driver is operating leverage as content cost growth decelerates from its Q2 2026 peak, a dynamic management has explicitly guided.
The upside scenario requires advertising to reach or exceed the $9 billion 2030 aspiration, with programmatic scaling faster than consensus currently models. The downside is what Pivotal Research is effectively pricing at $96: engagement growth stalls, short-form competition caps ad CPMs at the margin, and pricing power weakens as consumers resist further hikes. Netflix’s own ad tech stack only launched in 2025, and fill rates in international markets remain early-stage. That execution risk is real.
Conclusion
The single metric to watch is second-half 2026 advertising revenue. Management has committed to around $3 billion for the full year. Because Q2 carries the heaviest content cost load of 2026, the back half is where the ad target gets proven or missed. Good H2 means advertising accelerating as programmatic scales, alongside stable churn as the March U.S. price increases fully digest.
The threshold is clear: ad revenue tracking toward $1.5 billion or more in H2, with no material churn spike, confirms the thesis and closes the gap toward the Street’s $115 mean target. If ad revenue disappoints or churn rises, $87.68 will not hold as support.
Netflix reports Q2 results in mid-July. Whether this stock was cheap or just falling gets answered in October, when Q3 numbers tell investors whether the advertising engine is actually being built at the pace the model requires.
See what stocks billionaire investors are buying so you can follow the smart money with TIKR.
Should You Invest in Netflix?
The only way to really know is to look at the numbers yourself. TIKR gives you free access to the same institutional-quality financial data that professional analysts use to answer exactly that question.
Pull up Netflix, and you’ll see years of historical financials, what Wall Street analysts expect for revenue and earnings in the quarters ahead, how valuation multiples have moved over time, and whether price targets are trending up or down.
You can build a free watchlist to track Netflix alongside every other stock on your radar. No credit card required. Just the data you need to decide for yourself.
Analyze Netflix on TIKR Free →
Looking for New Opportunities?
- See what stocks billionaire investors are buying so you can follow the smart money.
- Analyze stocks in as little as 5 minutes with TIKR’s all-in-one, easy-to-use platform.
- The more rocks you overturn… the more opportunities you’ll uncover. Search 100K+ global stocks, global top investor holdings, and more with TIKR.
Disclaimer:
Please note that the articles on TIKR are not intended to serve as investment or financial advice from TIKR or our content team, nor are they recommendations to buy or sell any stocks. We create our content based on TIKR Terminal’s investment data and analysts’ estimates. Our analysis might not include recent company news or important updates. TIKR has no position in any stocks mentioned. Thank you for reading, and happy investing!


